Language:
Video Game Publishers
Use streaming data to support launches, live ops, and long‑term growth
Understand which creators and categories drive attention for your title and how interest changes over time. Benchmark performance, monitor trends, and inform marketing decisions with cross‑platform analytics.
Trusted by
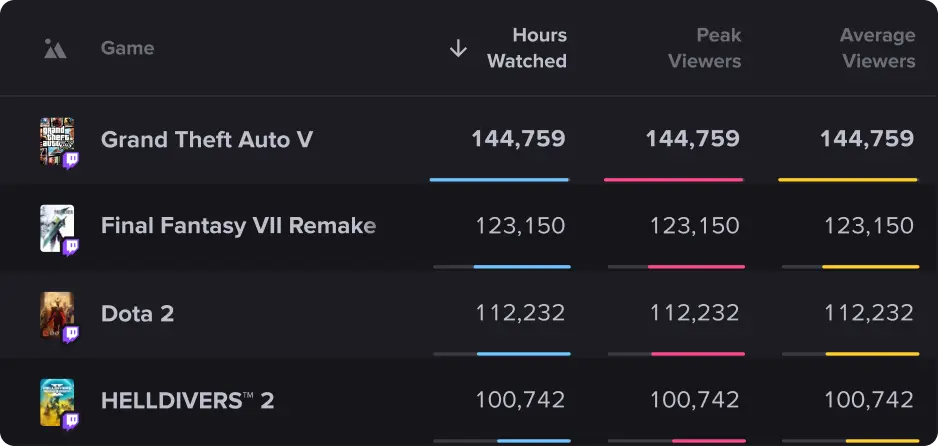
In-depth titles viewership data
Streams Charts collects and processes extensive data on live-streamed games, offering insights into regional viewership, statistics for individual channels and broadcasts, and a variety of additional features.
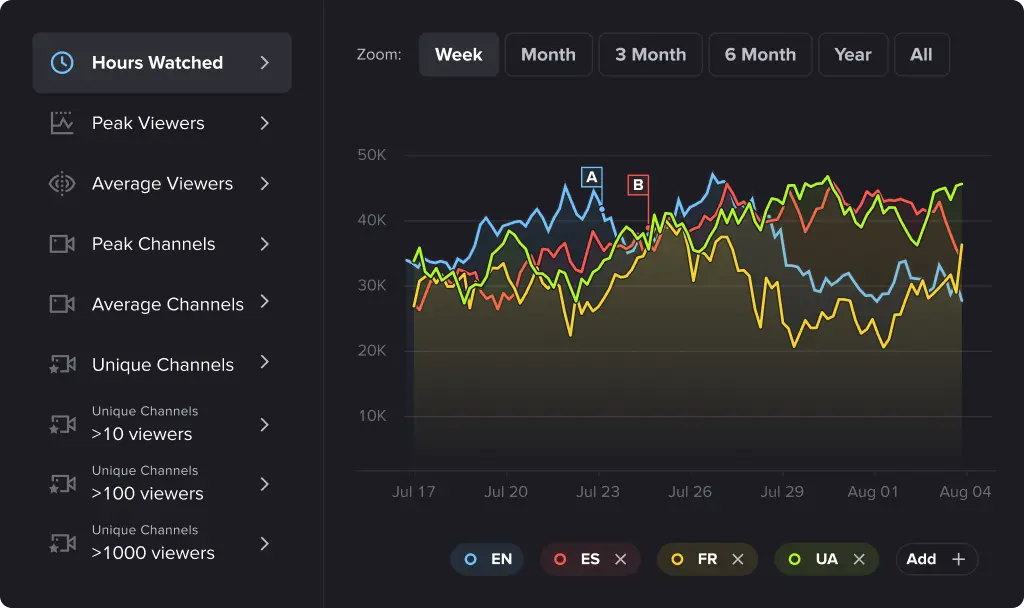
Detailed regional analytics
Do you want to know how popular your game is among audiences in Japan, Germany, and France? We offer comprehensive regional viewership data, including dynamic trends presented in easy-to-understand graphs
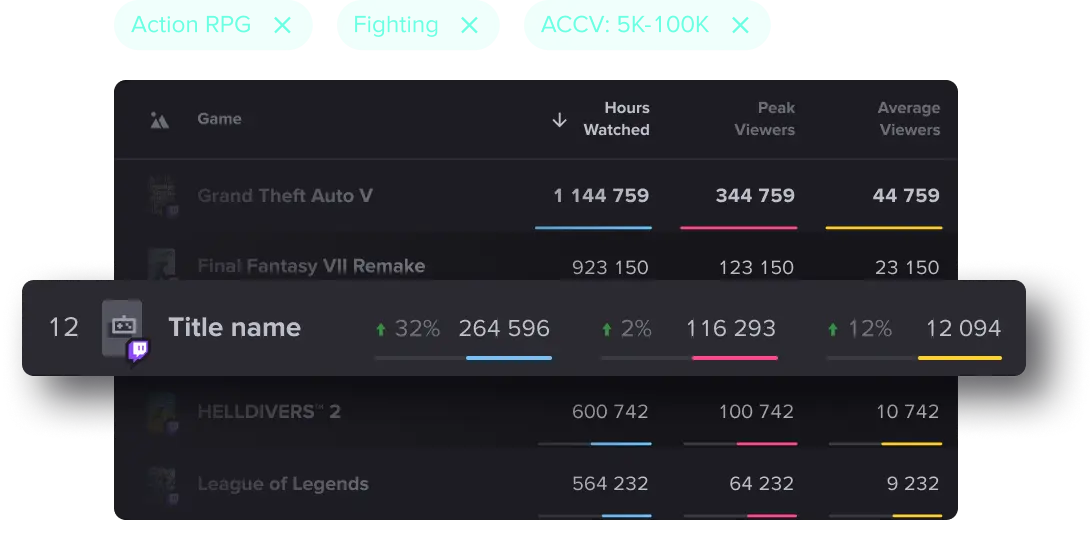
Market positioning insights
Not sure which region(s) to focus on when promoting your game? Convenient navigation through our database allows you to assess stats of similar titles and study viewer preferences across different regions.
Available products
-

Streams ChartsPRO
From $80 / month
Features:
- Simple Web Dashboard
- Cross-Platform Analytics
- Personal Customizable Lists
- Scouting Talents & Variety of Filters
- In-depth Games Viewership
-
Streams ChartsEnterprise
Custom
Features:
- Streaming Data API
- Esports and live streaming consulting
- Detailed custom reports
- Corporate subscription plan
- Functions for your needs
Testimonials
”
—
Use cases

- Use Cases
Understanding game viewership by platform: A strategic breakdown for publishers, brands & streamers
In today’s ever-growing yet fragmented livestreaming ecosystem, understanding how gaming audiences behave across platforms is no longer optional: it’s essential. Twitch, YouTube Live, TikTok, Kick, an...
Learn more
- Use Cases
Sponsored streams: A hidden force behind live game audiences?
Unless it’s a low-budget indie hit, most video game releases are backed by large-scale marketing campaigns aimed at building awareness. Among the usual promotional expenses, livestreaming influencers ...
Learn moreMore solutions
F.A.Q.
-
How do game publishers use Streams Charts for new launches?
Publishers rely on Streams Charts to track daily visibility, creator adoption, and viewer retention. By monitoring which influencers are playing their game and for how long, publishers use our data to measure marketing success and sustain post-launch momentum.
-
What is the best game category tracking tool for Twitch and YouTube?
Streams Charts is the premier category tracking tool, monitoring game performance across all major platforms. We provide data on viewership and engagement, helping publishers benchmark their game against competitors in the same genre.
-
How does Streams Charts help identify creators for "Partner Programs"?
Publishers use Streams Charts Discovery to find influencers with a high affinity for their game's genre. By analyzing a creator's "Game History" and "Audience Overlap," publishers can invite the most relevant streamers to their programs to ensure long-term growth.
-
Can Streams Charts track the impact of "Twitch Drops"?
Yes, Streams Charts can isolate viewership spikes associated with "Drops-enabled" campaigns. By comparing these streams against standard broadcasts, publishers use our data to quantify the "lift" in hours watched and refine their reward strategies.
-
How does Streams Charts monitor long-term community health?
By tracking "Average Channels Streaming" and "Viewer Retention" over years, Streams Charts helps publishers detect "content fatigue" early. This data is vital for timing DLC releases and seasonal events to re-engage both creators and audiences.